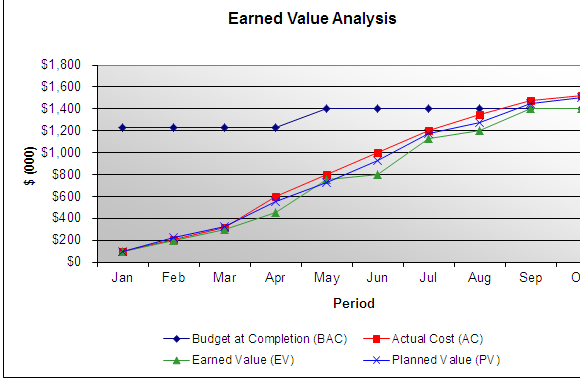
Example sheets contains chart. Don’t forget to check them.
Very first worksheet consist 3 tabbed sheets. Earned value,actual cost along with a report.If you want to check how this worksheet is working in background of the sheet just press ctrl+` button and all the formula’s will be revealed.You have to keep in mind that while inserting data WBS,task name and tbc are identical. You have to enter the percentage for each task to determine the CEV. This template manages to create chart as per input on the same sheet.Charts are created for earned value analysis. Along with performance index i.e determined while comparing cost performance index and schedule performance index. Don’t forget to read definitions sheet.
We have found another worksheet with a detailed view. How to do this by yourself in excel. Actually this one is an example of project performance report preparation.But the good thing is that. The author of this sheet has explained it in detail.
Formula :
| EV | Earned Value | EV = BAC x Actual % Complete | Actual worked peformed to date. |


